The blog
Search is changing fast. We write about what actually works.
Field notes on SEO, AI search, links and the tactics moving rankings right now. No fluff, no recycled advice.

How to Optimise Your Google Business Profile: The Step-by-Step Guide We Give Every Local Business
The free listing that beats paid ads for local searches, set up properly. Services, photos, reviews, posts and citations, in steps anyone can follow.
18 June 2026 · 6 min read
Read article11 June 2026 · 7 min read
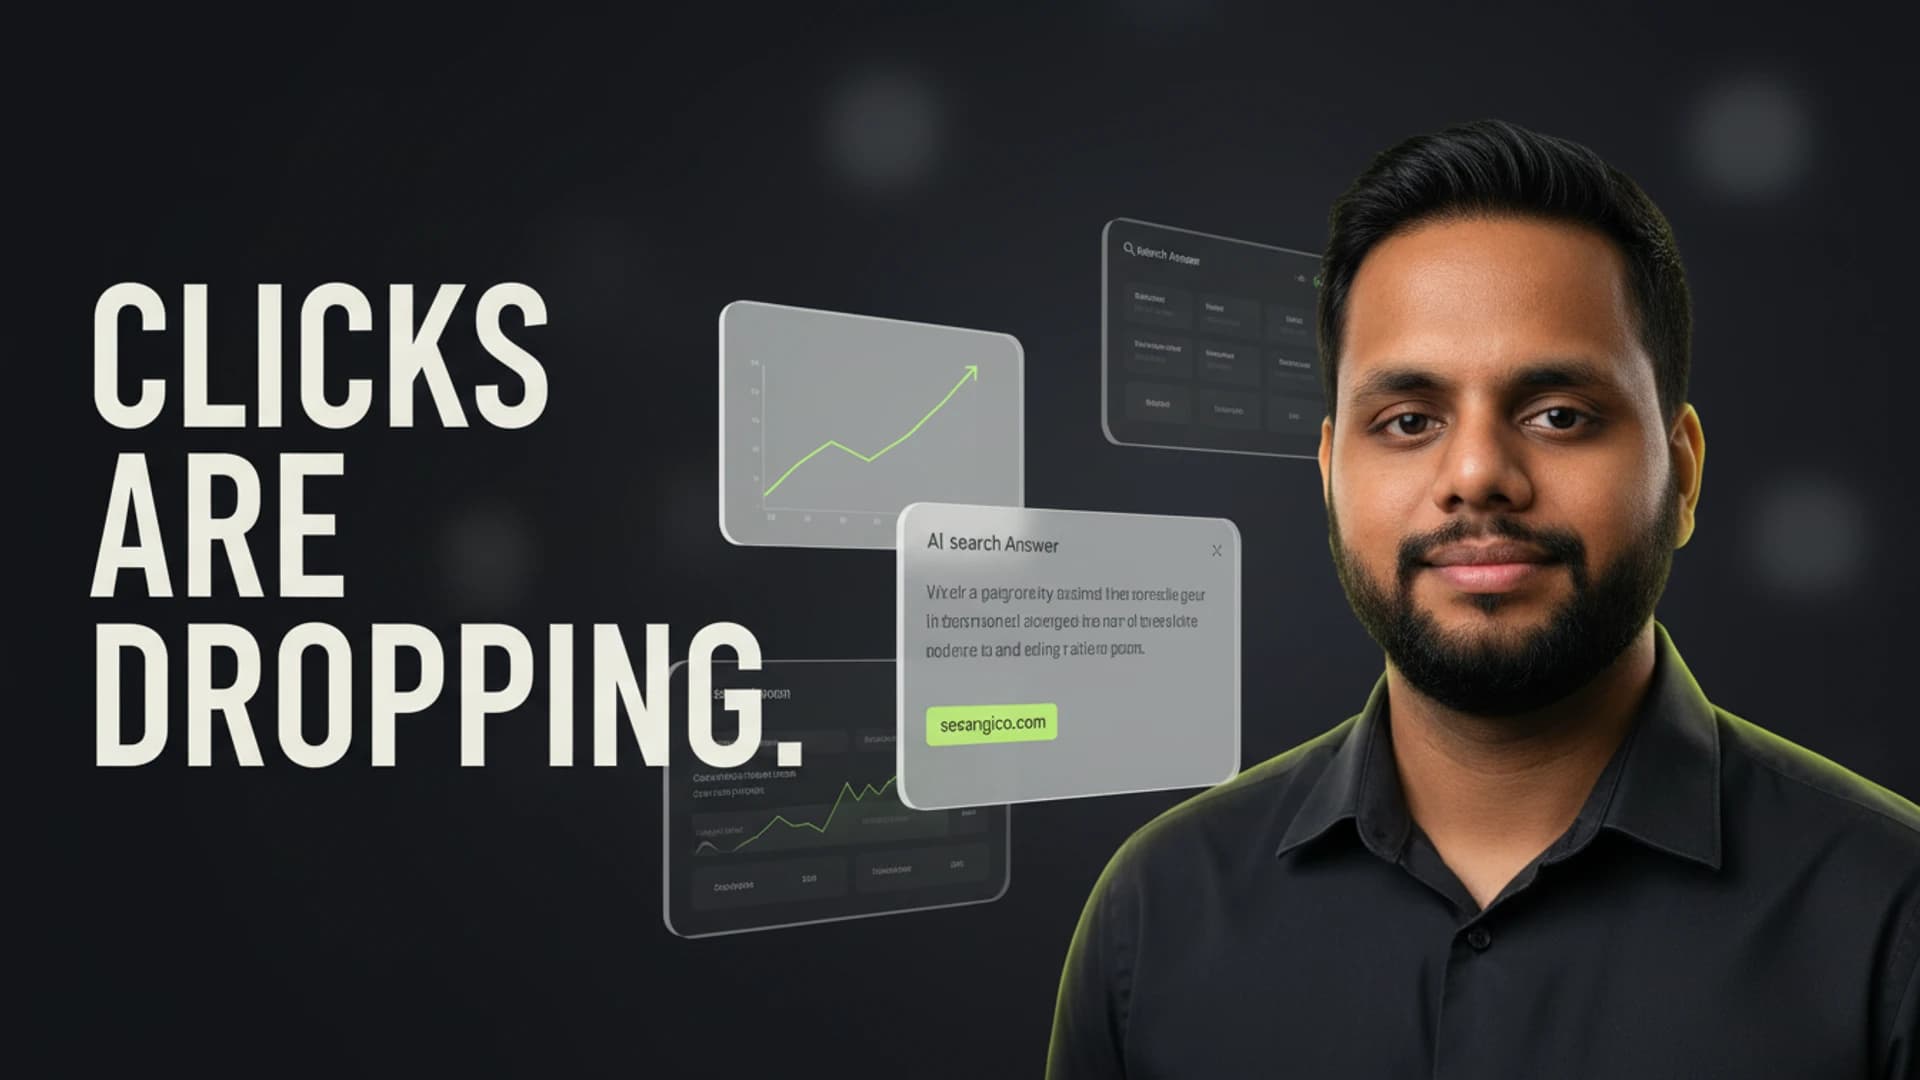
How to Rank in ChatGPT: Reverse-Engineering Where It Pulls Its Answers
 Link Building
1 June 2026 · 11 min read
Best Link Building Services in 2026 (Ranked and Reviewed)
 SEO
SEO27 May 2026 · 9 min read
Best SEO Agencies in the UK for 2026
 SEO
SEO25 May 2026 · 10 min read
Best SEO Agencies in London for 2026
 SEO
SEO22 May 2026 · 10 min read
Best SEO Agencies in Manchester for 2026
 SEO
SEO21 May 2026 · 11 min read
Best Ecommerce SEO Agencies for 2026
 SEO
SEO20 May 2026 · 10 min read
Best SEO Agencies in Birmingham for 2026
 SEO
SEO17 May 2026 · 10 min read
Best SEO Agencies in Leeds for 2026
 Link Building
15 May 2026 · 10 min read
Best Digital PR Agencies in the UK for 2026
 SEO
SEO15 May 2026 · 10 min read
Best SEO Agencies in Bristol for 2026
 SEO
SEO13 May 2026 · 9 min read
Best SEO Agencies in Edinburgh for 2026
 SEO
SEO10 May 2026 · 10 min read
Best SEO Agencies in Glasgow for 2026
 Google Ads
9 May 2026 · 9 min read
Best Google Ads Agencies in the UK for 2026
 SEO
SEO8 May 2026 · 10 min read
Best SEO Agencies in Liverpool for 2026
 SEO
SEO6 May 2026 · 10 min read
Best SEO Agencies in Newcastle for 2026
 Technical SEO
5 May 2026 · 17 min read
Faceted Navigation and Pagination: The Crawl Budget Killers I See on 80% of E-commerce Audits
 SEO
SEO3 May 2026 · 10 min read
Best SEO Agencies in Nottingham for 2026
 SEO
SEO2 May 2026 · 10 min read
Best B2B SEO Agencies for 2026
 SEO
SEO1 May 2026 · 10 min read
Best SEO Agencies in Cardiff for 2026
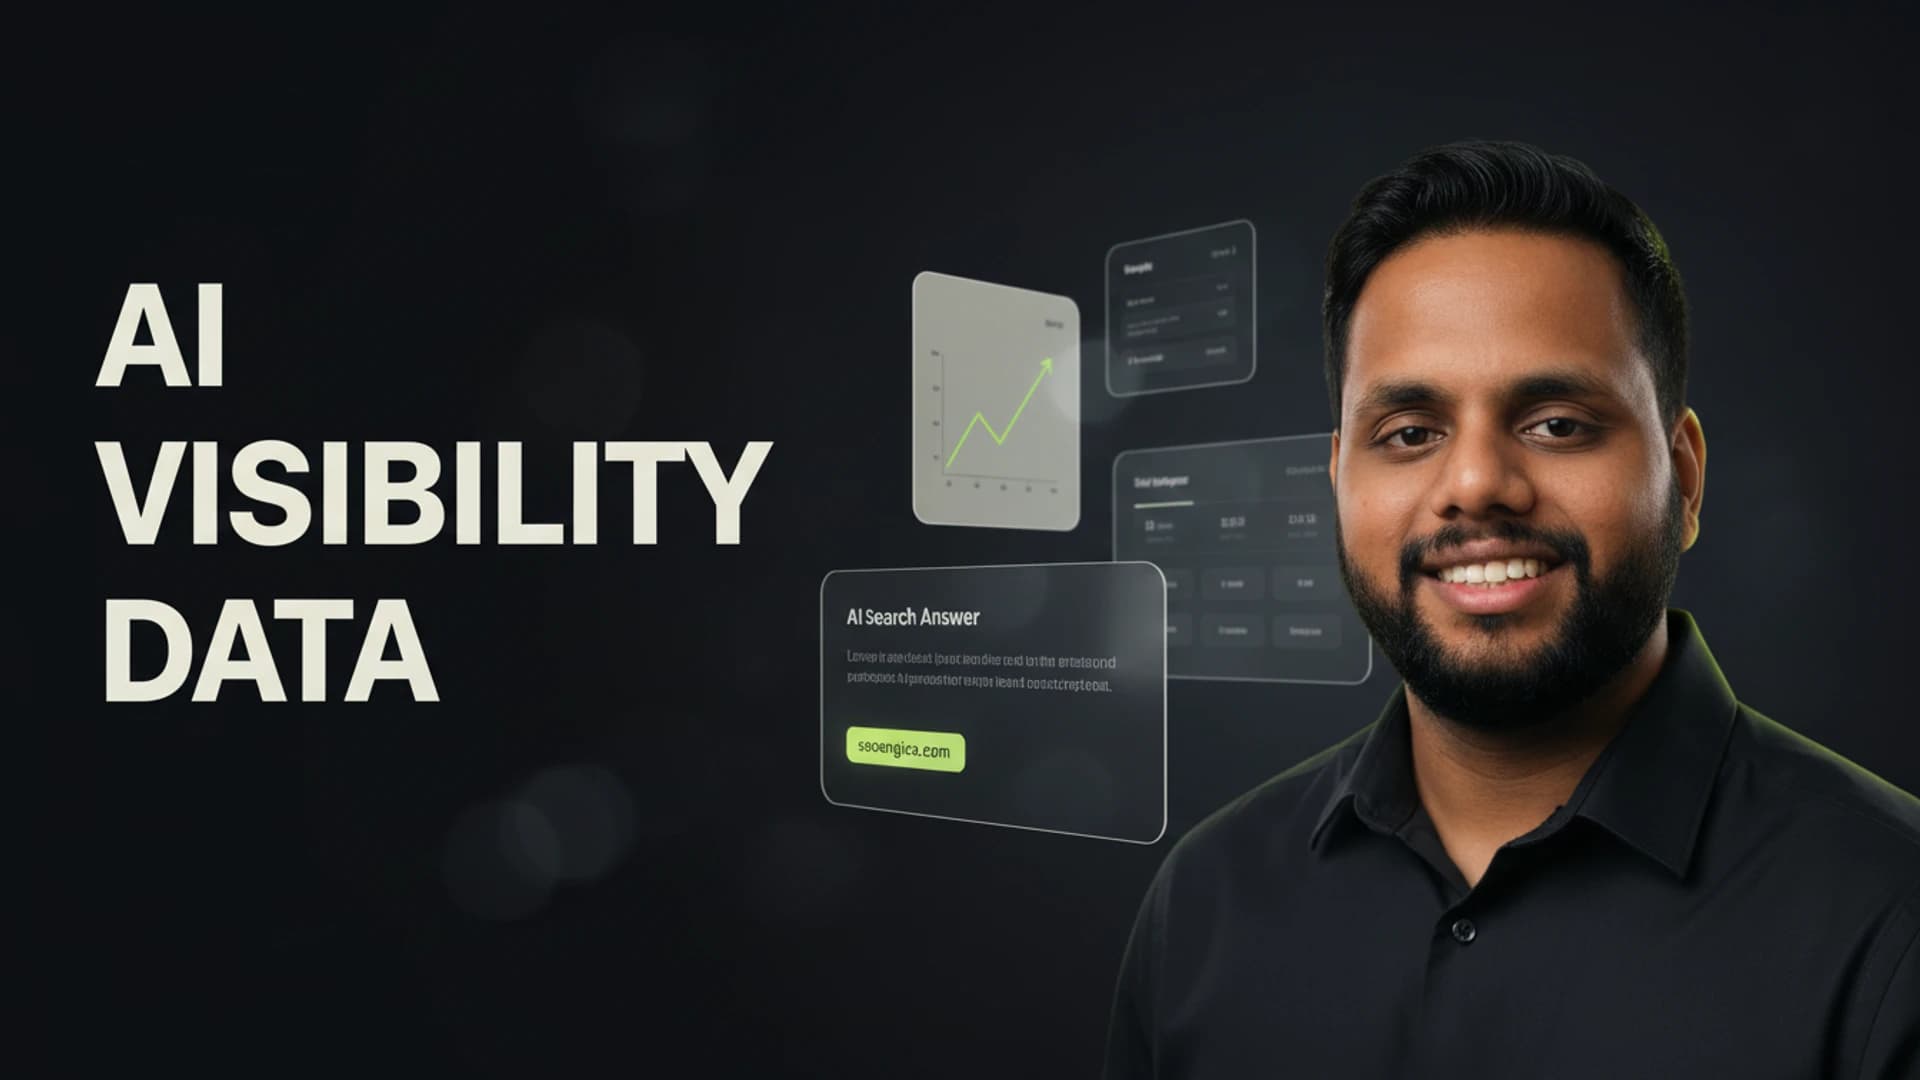
 AI Search
1 May 2026 · 13 min read
AI Engines Now Cite Images in Answers. Schema.org Quietly Replaced Alt Text as the Strongest Signal.
 AI Search
1 May 2026 · 11 min read
llms.txt: Should You Add One in 2026? What the 300k-Domain Data Actually Shows.
 Search Trends
1 May 2026 · 11 min read
Apple Intelligence Search Is on 200 Million Devices. Here's How Apple Picks What to Show.
 Search Trends
1 May 2026 · 13 min read
40% of Gen Z Skip Google for TikTok Search. I Reverse-Engineered 100 Top-Ranking TikToks. Here's the Pattern.
 AI Search
1 May 2026 · 14 min read
Cloudflare's Default-Block Policy Just Erased Millions of Sites From AI Search. Here's How to Check If Yours Is One.
 Link Building
30 April 2026 · 15 min read
Anchor Text in 2026: What Still Triggers Penguin, What AI Engines Actually Reward
 SEO
SEO29 April 2026 · 10 min read
Best SEO Agencies in Sheffield for 2026
 SEO
SEO28 April 2026 · 10 min read
Best SaaS SEO Agencies for 2026
 SEO
SEO27 April 2026 · 10 min read
Best SEO Agencies in Brighton for 2026
 SEO
SEO24 April 2026 · 10 min read
Best SEO Agencies in Leicester for 2026
 AI SEO
23 April 2026 · 10 min read
Best AI SEO and GEO Agencies for 2026
 Search Trends
23 April 2026 · 15 min read
Pinterest Is a Search Engine, Not Social. Here's How I'd Rank Products in 2026.
 SEO
SEO22 April 2026 · 11 min read
Best SEO Agencies in Belfast for 2026
 Content
21 April 2026 · 16 min read
Content Pruning in 2026: How I Delete 30% of Client Pages and Gain Traffic
 SEO
SEO20 April 2026 · 11 min read
Best SEO Agencies for Roofers in 2026
 Link Building
18 April 2026 · 10 min read
Best Guest Posting Services in 2026
 SEO
SEO18 April 2026 · 11 min read
Best SEO Agencies for Law Firms in 2026
 SEO
SEO16 April 2026 · 18 min read
Keyword Cannibalization Used to Cost Rankings. In 2026, It Costs You AI Citations Too.
 SEO
SEO15 April 2026 · 10 min read
Best SEO Agencies for Small Business in 2026
 Link Building
13 April 2026 · 10 min read
Best White-Label SEO and Link Building Providers for 2026
 SEO
SEO13 April 2026 · 11 min read
Best SEO Agencies for Dentists in 2026
 SEO
SEO11 April 2026 · 11 min read
Best SEO Agencies for Estate Agents in 2026
 Technical SEO
9 April 2026 · 18 min read
Site Migration in 2026: How to Move a Domain Without Losing Rankings OR AI Citations
 SEO
SEO8 April 2026 · 11 min read
Best Healthcare SEO Agencies in 2026
 SEO
SEO6 April 2026 · 11 min read
Best SEO Agencies for Plumbers in 2026
 SEO
SEO4 April 2026 · 11 min read
Best Automotive SEO Agencies in 2026
 AI Search
2 April 2026 · 17 min read
Wikipedia Is the #1 Training Source for ChatGPT. Here's How to Get Your Brand Listed Without Getting Reverted.
 SEO
SEO1 April 2026 · 10 min read
Best SEO Agencies for Accountants in 2026
 Technical SEO
31 March 2026 · 15 min read
I Audited Internal Linking on 300 Sites. Three Patterns Move Rankings. The Rest Waste Crawl Budget.
 SEO
SEO30 March 2026 · 11 min read
Best SEO Agencies for Electricians in 2026
 SEO
SEO28 March 2026 · 10 min read
Best Construction SEO Agencies in 2026
 Google Updates
27 March 2026 · 11 min read
Google Just Dropped a Spam Update and a Core Update in the Same Week. Here Is What I Am Seeing.
 AI & SEO
27 March 2026 · 12 min read
I Tested 5 SEO AI Agents. Most of Them Are Just Wrappers Around ChatGPT.
 AI & SEO
27 March 2026 · 11 min read
AI Content Detection: Does Google Actually Care? (After 10 Years in SEO, Here Is My Take)
 AI & SEO
27 March 2026 · 10 min read
LLM Optimization: How to Get Your Brand Into AI Answers (Practical Guide)
 Technical SEO
27 March 2026 · 10 min read
Programmatic SEO in 2026: When to Use It, When to Avoid It, and How I Build It
 AI & SEO
27 March 2026 · 10 min read
How to Optimize for Gemini Search: What I Have Found After 6 Months of Testing
 Healthcare
26 March 2026 · 13 min read
Dental SEO: How Dentists Actually Get Patients From Google
 Healthcare
26 March 2026 · 11 min read
SEO for Doctors: A Practical Guide That Skips the Fluff
 Healthcare
26 March 2026 · 13 min read
Google Reviews for Doctors: How to Get More (Without Being Pushy)
 Healthcare
26 March 2026 · 13 min read
Healthcare Content Marketing: What to Actually Write on Your Medical Website
 Healthcare
26 March 2026 · 11 min read
YMYL SEO: Why Google Holds Medical and Financial Sites to a Higher Standard
 SEO
SEO25 March 2026 · 11 min read
Best Restaurant SEO Agencies in 2026
 SEO
SEO23 March 2026 · 11 min read
Best SEO Agencies for Recruitment Firms in 2026
 SEO
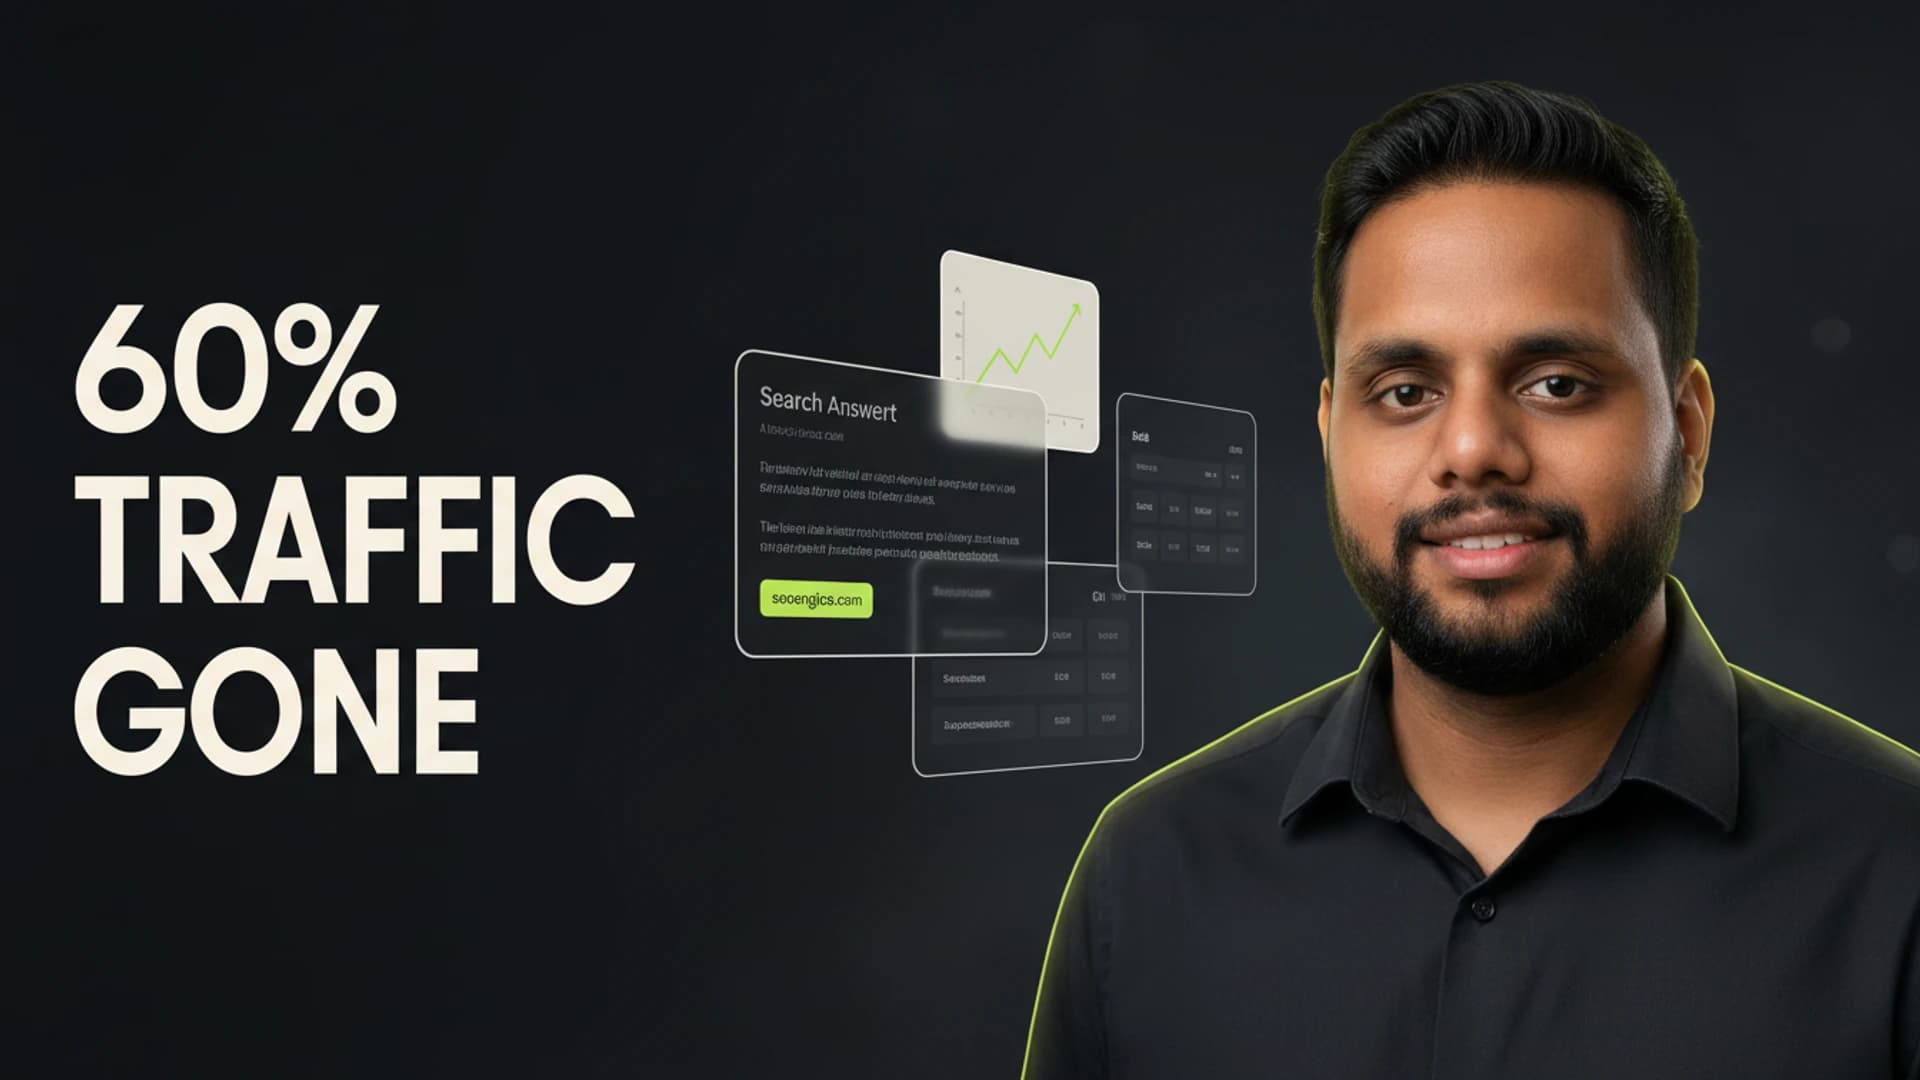
SEO21 March 2026 · 11 min read
Small Publishers Lost 60% of Their Google Traffic. I've Spent Two Weeks Figuring Out What to Do About It.
 SEO
SEO21 March 2026 · 11 min read
An SEO Published a Fake Google Update. It Ranked on Page One. That Should Terrify All of Us.
 SEO
SEO21 March 2026 · 10 min read
Best SEO Agencies for Manufacturers in 2026
 AI SEO
20 March 2026 · 18 min read
Subdomain vs Subdirectory in 2026: Which One Gets Cited More by ChatGPT and Gemini
 AI SEO
20 March 2026 · 10 min read
AI Overviews Hit 14% of Shopping Queries: What It Means
 AI SEO
20 March 2026 · 9 min read
Why 67% of Brands Fail at GEO: Avoid These Mistakes
 AI SEO
20 March 2026 · 11 min read
Why GEO Is 2026's Fastest Growing SEO Discipline
 AI SEO
19 March 2026 · 12 min read
Google Personal Intelligence AI Mode: 7 Things Free Users Need to Know
 AI SEO
19 March 2026 · 12 min read
How to Get Cited in ChatGPT AI Overviews (2024 Guide)
 AI SEO
19 March 2026 · 10 min read
Why AI Overviews Grew 58% in 2026 (And What It Means)
 SEO
SEO19 March 2026 · 10 min read
Best SEO Agencies for Startups in 2026
 Content SEO
18 March 2026 · 11 min read
Why AI Models Ignore 90% of Content (Research Fixes It)
 SEO
SEO16 March 2026 · 11 min read
Best SEO Agencies for Solicitors in 2026
 AI SEO
16 March 2026 · 10 min read
Why Knowledge Graphs Will Make or Break Your AI Search Visibility
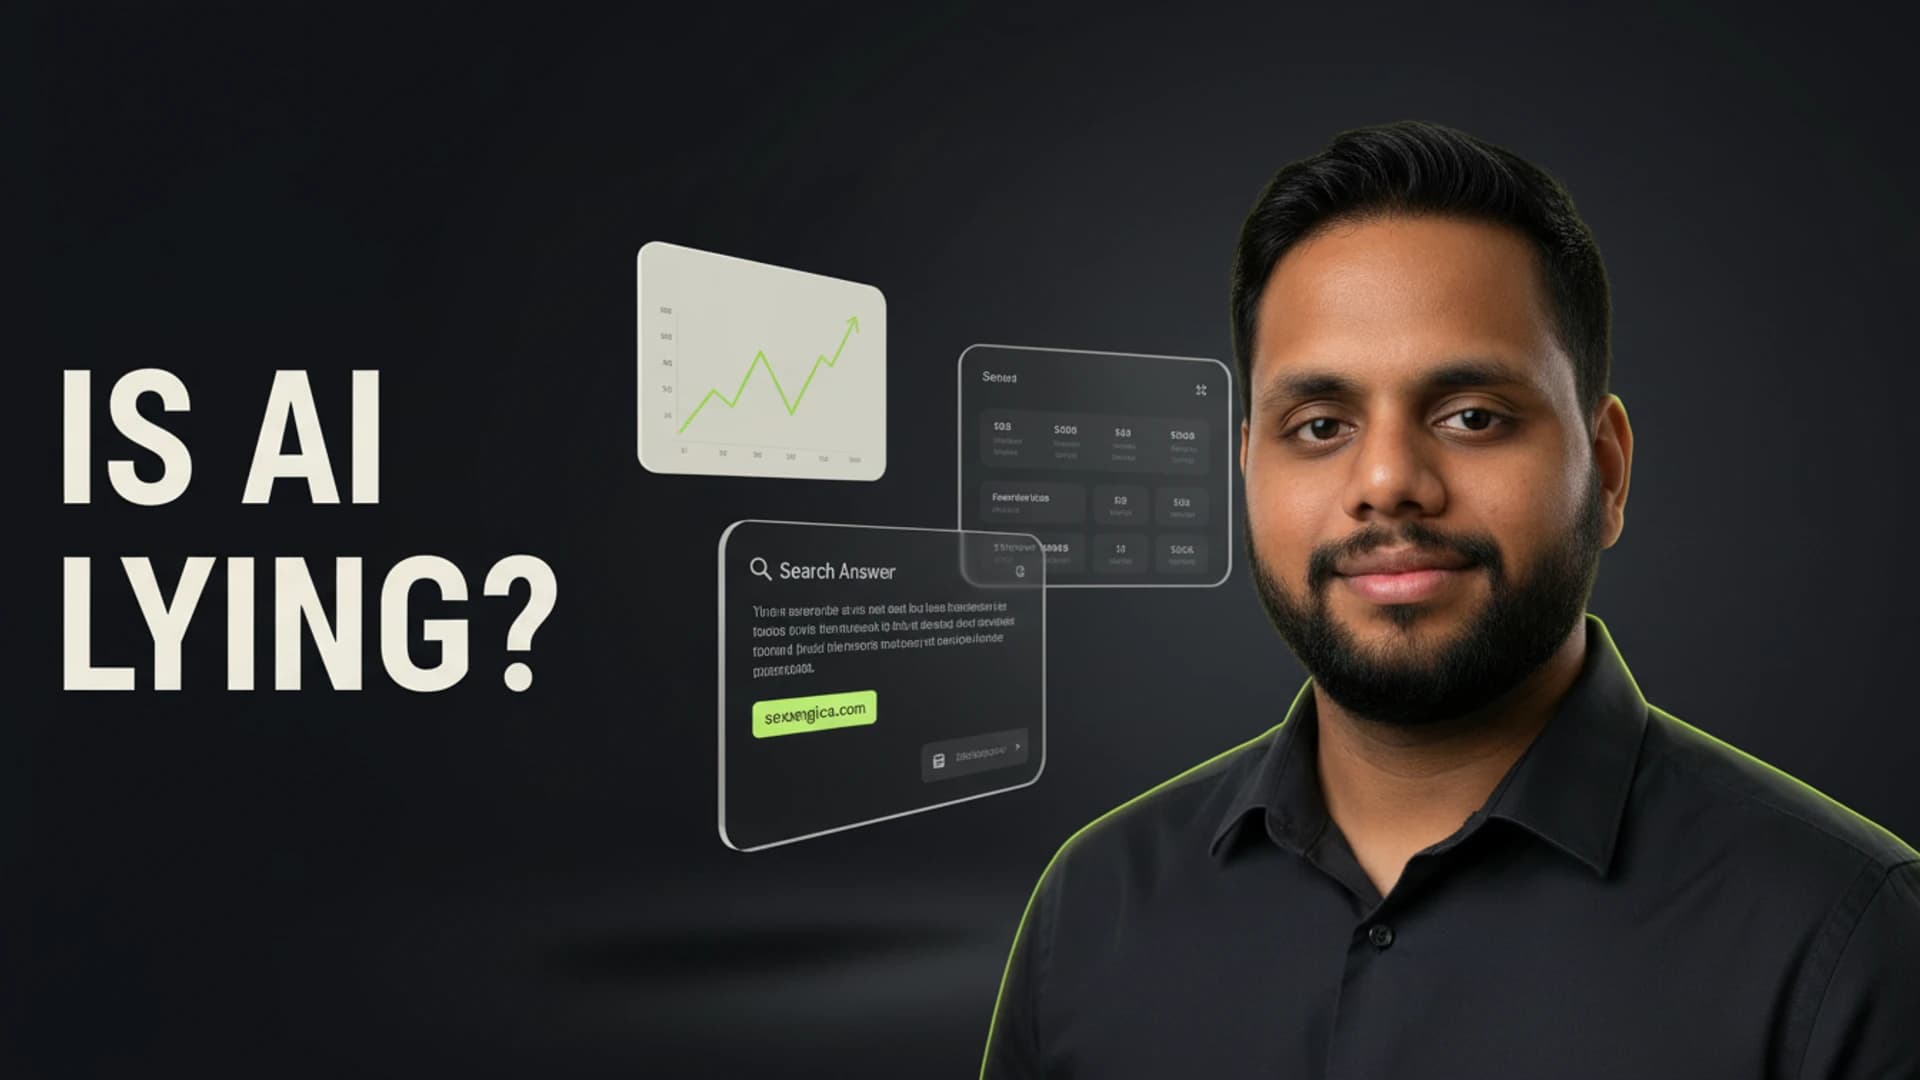 AI SEO
15 March 2026 · 12 min read
Is AI Lying About Your Brand? Defensive SEO Explained
 AI SEO
15 March 2026 · 11 min read
ChatGPT Search Optimization: 7 Strategies for 2026
 AI SEO
15 March 2026 · 11 min read
Why Top Rankings Lost 50% of AI Citations in 2026
 SEO
SEO14 March 2026 · 10 min read
Best SEO Agencies for Financial Advisors in 2026
 AI SEO
13 March 2026 · 11 min read
AI Overviews Killed 60% of Clicks: Your 2026 Survival Plan
 Search Trends
12 March 2026 · 15 min read
App Store Optimization for SEO Pros: What Transfers, What Doesn't, and Why It Matters in 2026
 SEO
SEO12 March 2026 · 9 min read
March 2026 Google Volatility: Why Your Rankings Won't Stabilize
 SEO
SEO12 March 2026 · 10 min read
Best Hotel SEO Agencies in 2026
 SEO
SEO11 March 2026 · 10 min read
Google's March 2026 Core Update: Who Won and Who Got Crushed
 AI SEO
10 March 2026 · 10 min read
Google AI Self-Citations Tripled: What Publishers Must Know
 SEO
SEO10 March 2026 · 10 min read
Best Veterinary SEO Agencies in 2026
 SEO
SEO9 March 2026 · 10 min read
Google Search Console AI Tool: 7 Things It Actually Does
 SEO
SEO7 March 2026 · 10 min read
Best Travel SEO Agencies in 2026
 SEO
SEO5 March 2026 · 10 min read
Best Fashion SEO Agencies in 2026
 SEO
SEO2 March 2026 · 9 min read
Best SEO Agencies for Charities in 2026
 SEO
SEO28 February 2026 · 10 min read
Best SEO Agencies for Gyms in 2026
 SEO
SEO26 February 2026 · 10 min read
Best Insurance SEO Agencies in 2026
 SEO
SEO23 February 2026 · 9 min read
Best SEO Agencies for Builders in 2026
 SEO
SEO22 February 2026 · 10 min read
February 2026 Discover Update: 67% Traffic Shifts Explained
 SEO
SEO21 February 2026 · 10 min read
Best SEO Agencies for Car Dealers in 2026
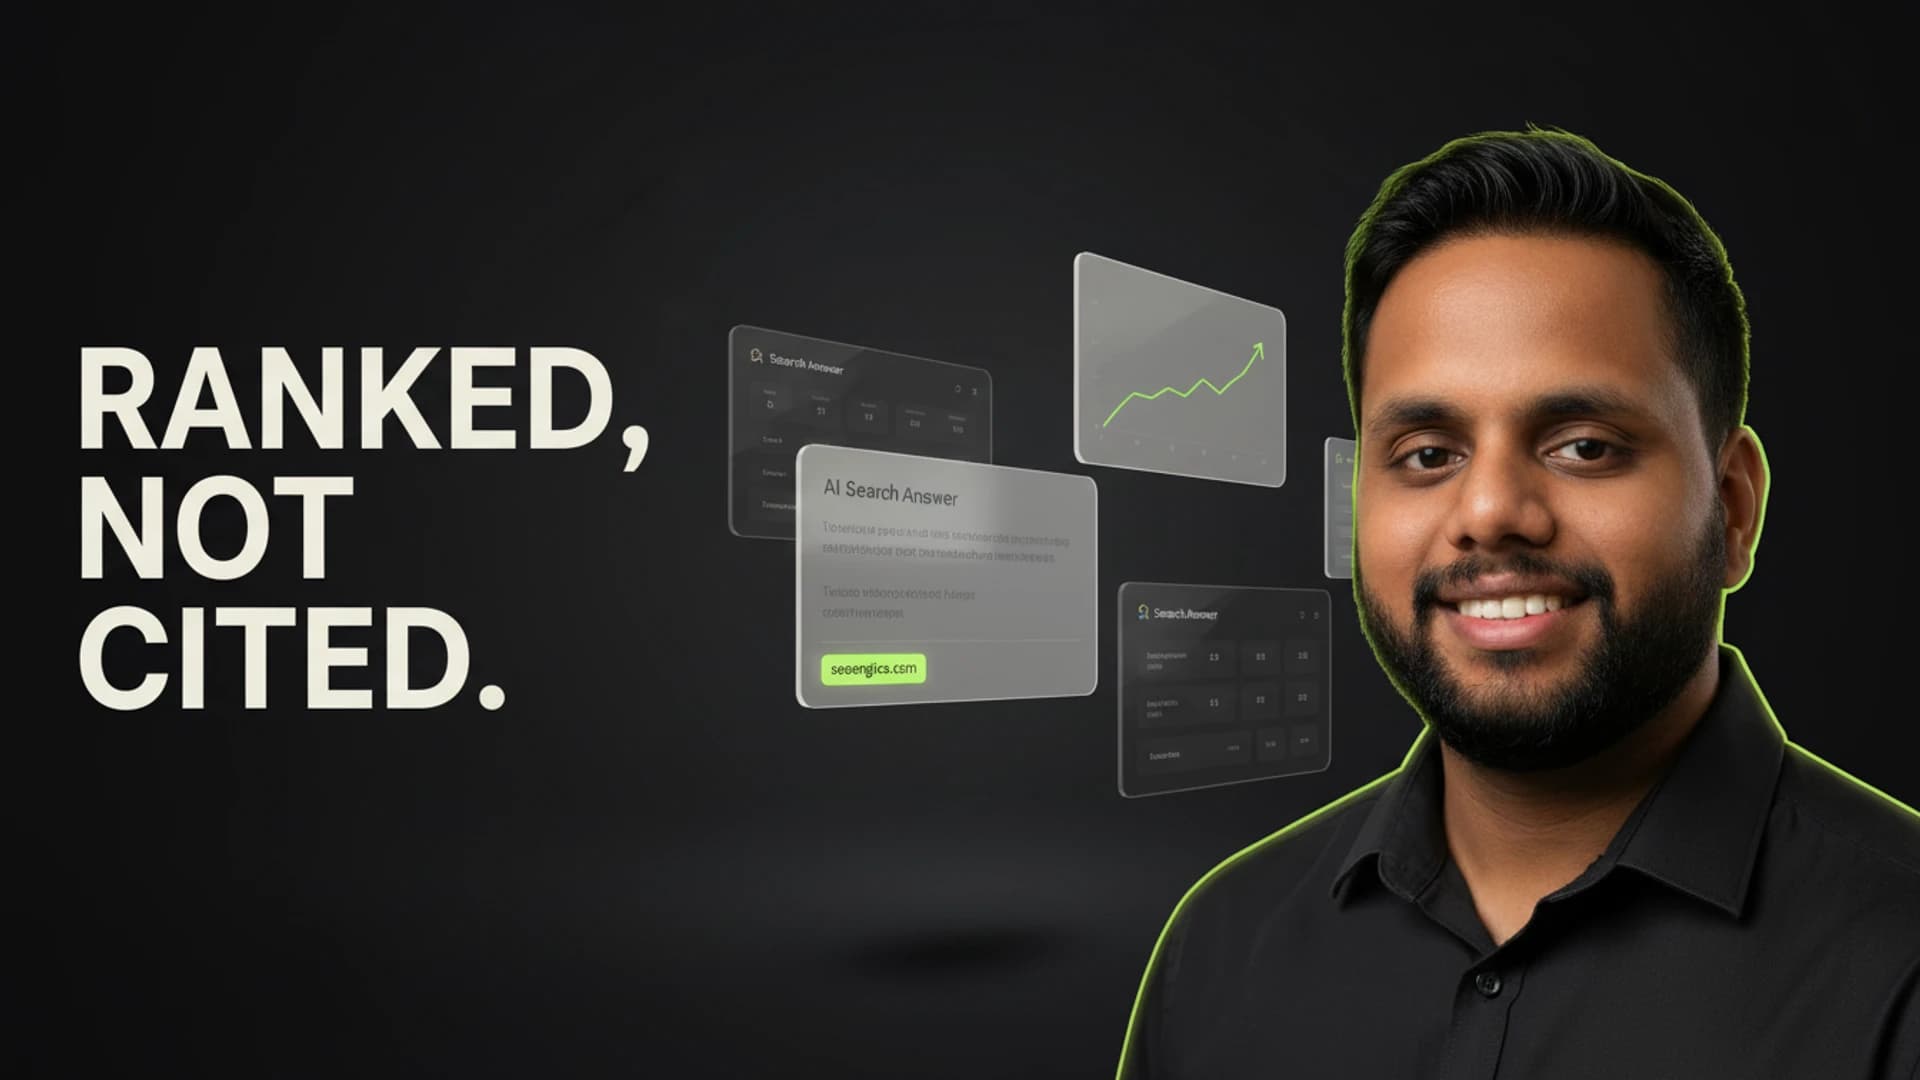
 AI SEO
21 February 2026 · 11 min read
44% of ChatGPT Citations Come From Your First 500 Words
 Case Studies
20 February 2026 · 12 min read
From 19 Clicks to 3.2 Million to Zero: The Grokipedia SEO Timeline
 SEO
SEO19 February 2026 · 11 min read
Best SEO Agencies for Schools in 2026
 SEO
SEO17 February 2026 · 12 min read
Best SEO Agencies for Universities in 2026
 SEO
SEO14 February 2026 · 10 min read
Best SEO Agencies for Architects in 2026
 SEO
SEO12 February 2026 · 10 min read
Best SEO Agencies for Cleaning Companies in 2026
 AI Tools
10 February 2026 · 13 min read
ChatGPT ranking 2026: Complete visibility guide
 SEO
SEO10 February 2026 · 10 min read
Best HVAC SEO Agencies in 2026
 SEO
SEO8 February 2026 · 12 min read
Link building agency implementation: White label framework for 2026
 SEO
SEO8 February 2026 · 12 min read
Keyword optimization vs user intent: which wins in 2026?
 SEO
SEO8 February 2026 · 14 min read
Technical SEO for service businesses: AI-ready strategies
 SEO
SEO8 February 2026 · 11 min read
Best SEO Agencies for Salons and Beauty Brands in 2026
 SEO
SEO8 February 2026 · 12 min read
Mobile search optimization: February 2026 algorithm survival guide
 SEO
SEO7 February 2026 · 13 min read
Robots.txt optimization: The 2026 guide to ChatGPT discovery
 SEO
SEO7 February 2026 · 13 min read
International link building ROI: A multi-region brand guide
 SEO
SEO6 February 2026 · 12 min read
White hat link building that survives Google's 2026 core updates
 SEO
SEO5 February 2026 · 11 min read
Best SEO Agencies for Dropshipping in 2026
 SEO
SEO3 February 2026 · 12 min read
Link reclamation vs new backlinks: Penguin recovery in 2026
 SEO
SEO3 February 2026 · 11 min read
Artificial intelligence SEO: how AI transforms search in 2025
 SEO Basics
3 February 2026 · 13 min read
What Is On-Page SEO? The Only Guide You Need (2026)
 SEO Basics
3 February 2026 · 11 min read
What Is SEO? A Straightforward Guide That Skips the Jargon
 SEO
SEO3 February 2026 · 10 min read
Best SEO Agencies for Nonprofits in 2026
 SEO
SEO1 February 2026 · 10 min read
Best SEO Agencies for Interior Designers in 2026
 SEO
SEO29 January 2026 · 9 min read
Best Fintech SEO Agencies in 2026
 SEO
SEO27 January 2026 · 11 min read
Best Cybersecurity SEO Agencies in 2026
 SEO
SEO25 January 2026 · 10 min read
Best Healthtech SEO Agencies in 2026
 SEO
SEO22 January 2026 · 10 min read
Best SEO Consultants in the UK for 2026
 SEO
SEO20 January 2026 · 10 min read
Best Technical SEO Agencies in 2026
 SEO
SEO18 January 2026 · 10 min read
Best International SEO Agencies in 2026
 SEO
SEO15 January 2026 · 10 min read
Best Enterprise SEO Agencies in 2026
 Content
13 January 2026 · 10 min read
Best Content Marketing Agencies in the UK for 2026
 SEO
SEO11 January 2026 · 11 min read
Best Shopify SEO Agencies in 2026
 SEO
SEO9 January 2026 · 11 min read
Best Magento SEO Agencies in 2026
 SEO
SEO6 January 2026 · 11 min read
Best WooCommerce SEO Agencies in 2026
 SEO
SEO4 January 2026 · 10 min read
Best BigCommerce SEO Agencies in 2026
 Link Building
2 January 2026 · 10 min read
Best Ecommerce Link Building Services in 2026
 Link Building
31 December 2025 · 11 min read
Best SaaS Link Building Agencies in 2026
 Link Building
28 December 2025 · 11 min read
Best B2B Link Building Services in 2026
 Link Building
26 December 2025 · 11 min read
Best iGaming and Casino Link Building Services in 2026
 Link Building
24 December 2025 · 11 min read
Best CBD Link Building Services in 2026
 Link Building
21 December 2025 · 11 min read
Best Crypto Link Building Services in 2026
 Link Building
19 December 2025 · 10 min read
Best Law Firm Link Building Services in 2026
 Link Building
16 December 2025 · 11 min read
Best Real Estate Link Building Services in 2026
 Link Building
14 December 2025 · 11 min read
Best Ecommerce Digital PR Agencies in 2026
 Link Building
12 December 2025 · 10 min read
Best B2B Digital PR Agencies in 2026
 Link Building
9 December 2025 · 10 min read
Best SaaS Digital PR Agencies in 2026
 Link Building
7 December 2025 · 9 min read
Best Travel Digital PR Agencies in 2026
 Link Building
5 December 2025 · 11 min read
Best Fashion PR Agencies in 2026
 Google Ads
3 December 2025 · 10 min read
Best PPC Agencies for Ecommerce in 2026
 Google Ads
1 December 2025 · 11 min read
Best PPC Agencies for Law Firms in 2026
 Google Ads
28 November 2025 · 10 min read
Best PPC Agencies for Lead Generation in 2026
 Google Ads
26 November 2025 · 10 min read
Best Google Ads Agencies for Dentists in 2026
 Google Ads
24 November 2025 · 10 min read
Best Google Ads Agencies for Plumbers in 2026
 Google Ads
21 November 2025 · 10 min read
Best Google Ads Agencies for SaaS in 2026
 Google Ads
19 November 2025 · 11 min read
Best Google Ads Agencies for Real Estate in 2026
 Google Ads
17 November 2025 · 11 min read
Best Google Shopping Ads Agencies in 2026
 Web Design
14 November 2025 · 11 min read
Best WordPress Web Design Agencies in 2026
 Web Design
12 November 2025 · 11 min read
Best Web Design Agencies for Law Firms in 2026
 Web Design
10 November 2025 · 10 min read
Best Ecommerce Web Design Agencies in 2026
 Web Design
7 November 2025 · 11 min read
Best Web Design Agencies for Tradesmen in 2026
 Web Design
5 November 2025 · 11 min read
Best Web Design Agencies for Estate Agents in 2026
 Web Design
3 November 2025 · 11 min read
Best Web Design Agencies for Restaurants in 2026
 Web Design
31 October 2025 · 11 min read
Best Shopify Web Design Agencies in 2026
Want this run on your own site?
We turn the tactics in these posts into a plan for your business. Start with a search performance audit and see where the wins are.